Where does the time go?! This will be the 10th consecutive year we’ve released a winter outlook as the IndyWx.com brand. Thankfully, most of those outlooks have been rather accurate! A few of you have been along for the ride from day 1 and your continued support means more than you realize!
Our official, finalized, winter outlook will be published just before Halloween. It’s our expectation that there won’t be many significant changes to what we present below, but fall storms and tropical activity can have big impacts on the sea surface temperature patterns and the impacts can be profound in the 2-4 month period that follows. That’s the primary reason we have never released an official outlook before mid-late October. With that said, let’s dig in to the drivers behind the upcoming winter:
I. Warm anomalies across the northeastern Pacific
II. Neutral ENSO
III. Warm anomalies across the eastern Atlantic
IV. Cold waters surrounding Australia
Let’s look first at the sea surface temperature anomalies:

First and foremost, what’s absolutely screaming out as potentially wanting to take control as the driving force this winter is the significantly warmer than average eastern Pacific waters. This is significant as the warmer than average waters can alter the upper air pattern, promoting a ‘mean’ ridge across the western US and into Canada with a persistent eastern trough downstream. This kind of pattern can be rather persistent in “dislodging” cold Canadian air southeast and can promote a colder to significantly colder than average weather pattern across the Mid West, Great Lakes and into parts of the East. While the warmth across the eastern Atlantic can argue for warmer than average temperatures to kick-off meteorological winter across the eastern seaboard, the makeup of cold and warm off New England and into the Canadian Maritimes can argue for a negative NAO later in the winter (something to consider if we keep this configuration into the mid winter period especially).
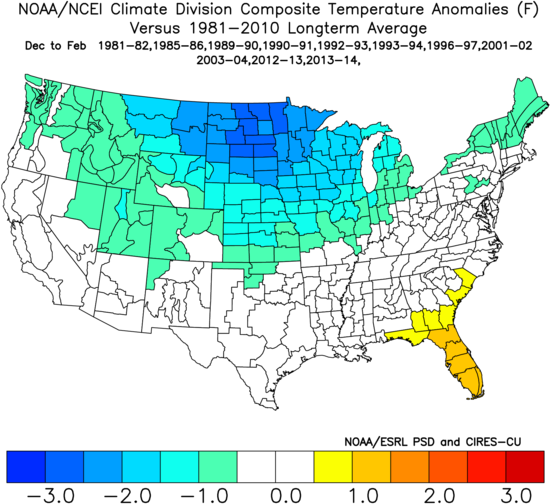
All things considered above, here’s our early analog set from a temperature (image 1) and precipitation (image 2) perspective:


While we’ll most certainly have to tweak some of these years as we move through the next 30 days, or so, this serves as a great baseline of what our temperature and precipitation maps may resemble with the finalized winter outlook next month.
We’re fired up for what sure looks like a stormy time of things through the Ohio Valley into the Great Lakes and interior Northeast. Based on the direction the Pacific goes, the potential is there for more of a southeast ridge and warmer look across portions of the Deep South. We’re also beginning to think the West Coast is likely to run warmer than what is shown above based off the Pacific temperature pattern.
The early call here for central Indiana is for a colder than normal winter with above average snowfall. We’ll have our finalized numbers with respect to temperatures and snowfall amounts next month, along with the latest seasonal and climate data included with our updated analog sets.
In the meantime, it might not be a bad idea to take advantage of those early season snow thrower deals out there!
