Category: Monthly Outlook

CFSv2 Catching On?

Just a quick post to highlight the recent trend from the CFSv2. Note as we’ve progressed through the past couple weeks the model has been shifting the mean ridge position…

You must be logged in to view this content. Click Here to become a member of IndyWX.com for full access.  Already a member of IndyWx.com All-Access?  Log-in here.

Permanent link to this article: https://indywx.com/cfsv2-catching-on/

August Outlook

Before we dive into what we expect for the month of August, here’s a look at where we stand so far for July (with 4 days left as of this post).

This was our July forecast upper air pattern, issued 6.29:

July2015UAHere’s a look at temperature anomalies through 7.27:

ncep_cfsr_noram_t2m_anomWhile overnight lows have been running warm with all of the clouds and moisture, daytime highs have been significantly below average:

tmax30dydevWith four days left in the month, it’s already been the wettest month on record at IND.  The Corn Belt, as a whole, has been quite wet month-to-date.

nws_precip_conus2_mtd nws_precip_indy_mtd precip30dydevAs we progress into August (where does time go) we think we continue in an active pattern, locally, biased cooler than normal and wetter than normal.

AugustUA2015While modeling disagrees with the specifics in regards to the timing, most mid to long range modeling does agree on the overall idea of the hot dome (ridge) backing west and setting up shop over the southwest portion of the country early August which will put our region in (you guessed it) the favorable northwest flow for active weather.  Similar to July, disturbances will ride the periphery of the hot dome to our southwest and offer up plenty of chances for showers and thunderstorms.  That’s not to say we’re looking at setting another record for greatest amount of rain within a month, but it is saying precipitation should be above average yet again.

From time to time the ridge will attempt to expand northeast, but we don’t think it’s potentially until the last portion of the month before the ridge has much chance to encompass our region for any staying power more than a few days.  We suggest getting used to this 500mb look:

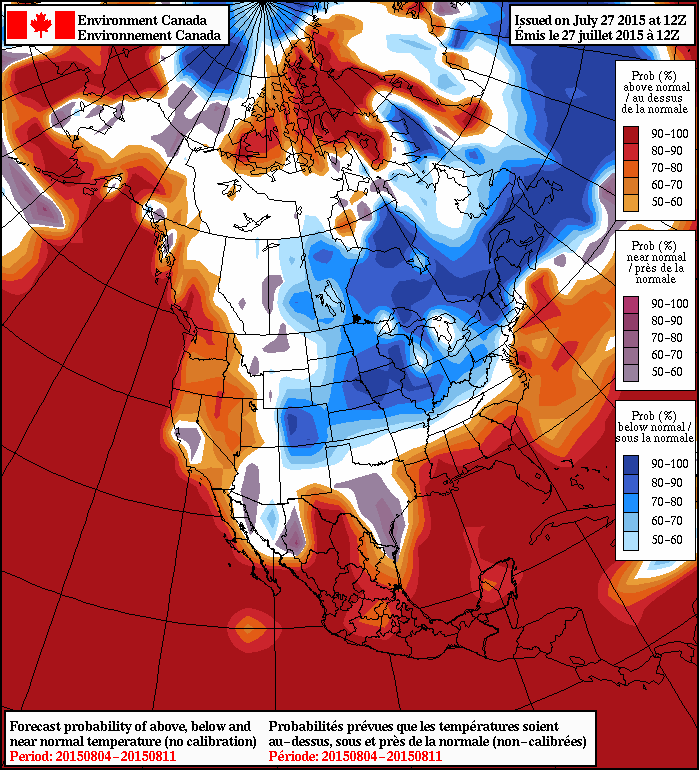
EarlyAugThe latest NAEFS and CFSv2 highlights the cooler than normal period we should undergo early August (especially after the 5th).

wk1.wk2_20150726.NAsfcT2015072712_054@007_E1_north@america_I_NAEFS@TEMPERATURE_anomaly@probability@combined@week2_186The latest European Weeklies suggest there may be a window for a “calmer” regime after the 25th.  That said, it’s a rather volatile pattern.

Yet another tool we’ve been keeping a close eye on the past few months has been the SOI (Southern Oscillation Index) as it’s been a big help in tipping us off for prolonged wet weather.  Note the consistent negative SOI:

Screen Shot 2015-07-27 at 11.22.11 PM


World

Not to sound like a broken record, but we continue to think the relentless wet weather pattern “keeps on keepin’ on” as we progress through August.  It’s very interesting to note the dynamics at play between the strengthening El Nino and warm northeast PAC waters… More on that, and the implications we feel for fall and winter, in the weeks and months ahead. 🙂

July2015SST

Permanent link to this article: https://indywx.com/august-outlook-2/

Sunday Morning Catch Up…

We hope this finds you coming off an enjoyable Independence Day with friends and family! As we look at the snap shot of the opening to July we see that…

You must be logged in to view this content. Click Here to become a member of IndyWX.com for full access.  Already a member of IndyWx.com All-Access?  Log-in here.

Permanent link to this article: https://indywx.com/sunday-morning-catch-up-2/

July Outlook

With only a few days left of June, thoughts are turning to the 4th of July holiday, getting those summer vacations taken care of before school starts back, and pre season football practice starting up.

June will finish as one of the wettest on record, and coming on the heels of a very dry May, we’re actually right where we should be from a year-to-date precipitation perspective.

Here are some highlights we’re focusing in on that’ll impact our July weather:

  • Highly amplified MJO
  • Very wet June through the Mid West/ Ohio Valley
  • Warm water off the East Coast
  • Persistent western ridging

June will finish as a top 5-10 wettest June on record for many communities throughout our immediate region. With the wet conditions, it’s very tough to get any sort of long-lasting truly hot weather and while we’re certain to have plenty of warm, humid days during the upcoming four weeks (it is July, after all), we don’t anticipate any sort of significant heat wave. We fully expect being able to save on cooling costs when compared to normal.  We also note a highly amplified MJO, or Madden-Julian oscillation.

In July, phases 6-7 are cool signals for our region.

  
 We note sea surface temperatures are quite warm off the eastern seaboard and in the Gulf of Mexico. While this doesn’t have a direct impact on our weather here in regards to temperature, it can suggest some southeast and eastern ridging at times. When we look at the upper air pattern below, we note the region will likely be in between predominant ridge positions east and west for July. The end result for our particular part of the country would be a cooler and continued unsettled time of things for the better part of July.


*As a side note, this sort of water profile does “raise an eyebrow” for potential tropical activity in the Gulf and potentially along the east coast, and that’s something that we’ll have to keep a close eye on as we progress into the heart of the season.

We sort through a variety of data to help build our weekly (client based) and monthly upper air charts. While we can’t share all of those forecast models here directly with you (due to licensing), a combination of GFS ensemble data, CFSv2, and European weeklies have helped us build this upper air pattern for July.

July2015UAThis would provide continued cooler than normal times (particularly daytime highs, considering the wet ground) and a busy time tracking cold fronts and individual disturbances that will ignite frequent showers and thunderstorms.

“Average” July weather for IND includes mid 80s for highs, mid 60s for lows, and 4.5″ of rainfall.  In summary, we anticipate July 2015 to run 2-3 degrees below average and precipitation to run above normal by a couple inches.  We think we just keep on rolling down the tracks from the wet and active regime put into place in June.  Time will tell!

Permanent link to this article: https://indywx.com/july-outlook/

Short-term Cold; Mid-range Warm…

There’s been a ton of conversation as of late about where this overall weather pattern is heading.  Perhaps it’s the Christmas season that brings out the conversation as everyone is hoping for that cold pattern to provide a White Christmas.

While in the short-term cold will continue to dominate, we’re becoming increasingly confident of an unseasonably mild stretch of air in the mid-range period.  That’ll take us up to the week before Christmas…

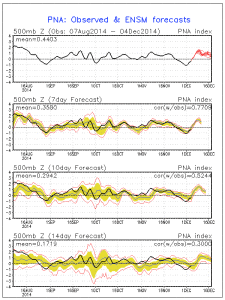
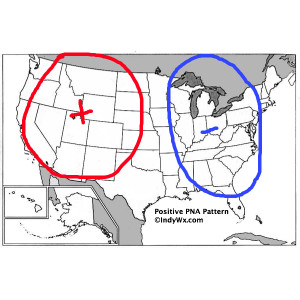
In the short-term, the positive PNA will continue to be the primary driver in our pattern.  This will ensure a colder east through the majority of week 1 (through next Friday).

pna.sprd2

A positive PNA pattern typically leads to below normal heights (trough) and associated cooler than normal pattern across the eastern region.

A positive PNA pattern typically leads to below normal heights (trough) and associated cooler than normal pattern across the eastern region.

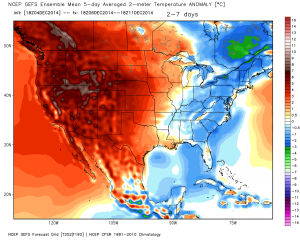
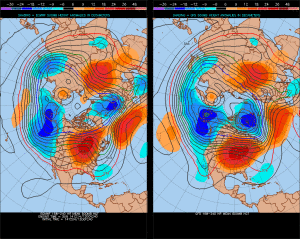
Modeling sees the cool east in week 1 and warm west- typical of a positive PNA pattern:

gefs_t2anom_by5_conus_29

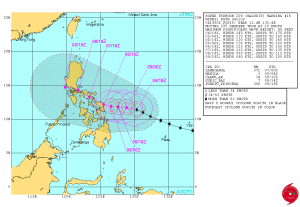
There are changes in the mid-range period that’ll have lovers of winter and cold frowning.  Many of our long-term readers know how we use the “typhoon rule” as a good indication of what we can expect across our region 6-10 days down the road.  As stated multiple times in the past (want to give credit where credit is due), we learned this from the great Joe Bastardi.  For those that are new here, I’ll describe this very briefly (you can read through the archives, if you’d like, for a longer/ more detailed description).  Typically when you have a recurving typhoon in the WPAC, that suggests a trough (colder pattern) across the central and eastern Lower 48.  On the flip side, when you have a westward moving typhoon, that’s a good indication of eastern ridging (warmer pattern).

Courtesy of the Joint Typhoon Warning Center, Super Typhoon Hagupit is forecast to move on a general westward trajectory.

wp2214

This is a very good sign of a much milder than normal period in the mid-range (days 8-12).  Modeling, in return, is going towards a warm pattern (associated ridge) week 2:

test8

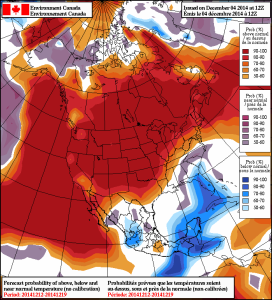
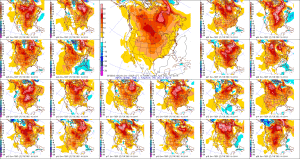
The GFS ensembles and NAEFS agree on the warmth and given what we’ve discussed above, so do we:

2014120412_054@007_E1_north@america_I_NAEFS@TEMPERATURE_anomaly@probability@combined@week2_186

D12

In fact, it wouldn’t surprise us to see high temperatures in the 55-60 degree range during a day or two week 2.

Really quick and before we end- lovers of winter weather, there’s absolutely NO reason to throw in the towel.  In fact, indications in the long range suggest the trough collapses into the east during the week leading up to Christmas and that could provide for all sorts of wintry “mischief” when almost all of folks are wanting snow…

Much more on that in the days ahead.  Have a great night!

Permanent link to this article: https://indywx.com/short-term-cold-mid-range-warm/