Thoughts Begin To Shift To Fall (And Winter)…
While we still have a few weeks left of meteorological summer, we’re hard at work finalizing our fall outlook and prep continues for winter. By the way, our fall outlook will be online Friday morning, the 28th.
From this distance, there’s obviously a risk involved with seasonal data that we’re reviewing and tweaks (particularly to the initial winter idea) will undoubtedly have to be made. In short, we anticipate a weak La Niña to dominate the fall and winter, with a robust MJO.
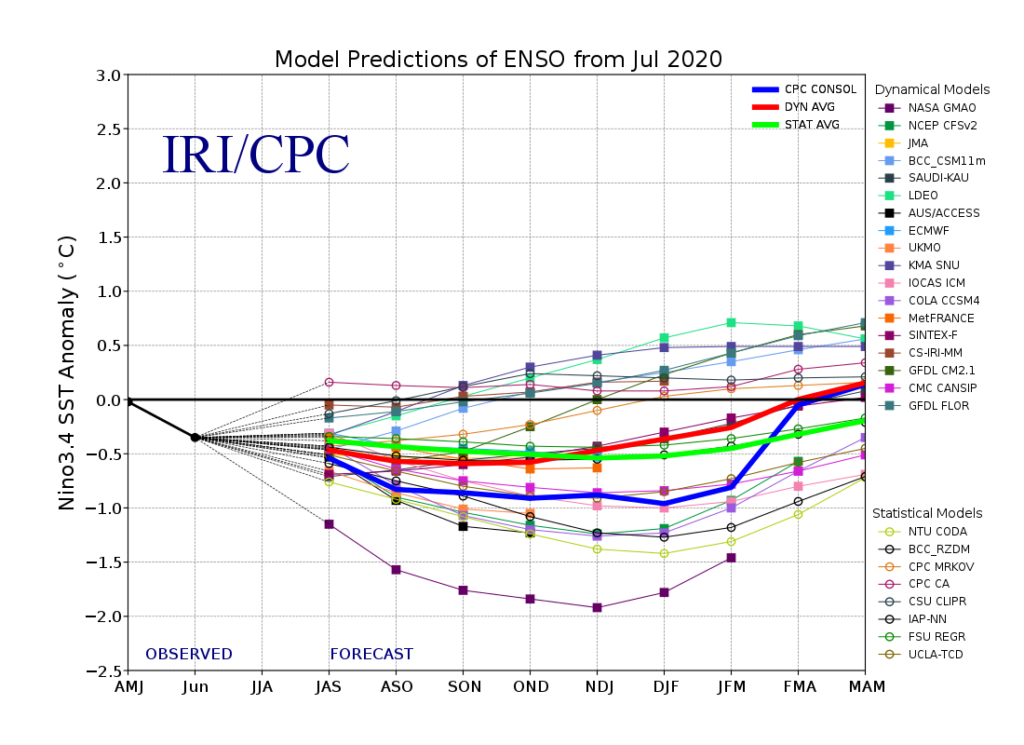
Of course, it’s important to remember, no La Niña is like the other and a simple “broad brush” approach never works.
Without question, the tropics will claim headlines through the fall. Unfortunately, like others, we anticipate a significant uptick in activity late August into October. A few major hurricanes are likely, as well. The Gulf of Mexico and Carolina coast appears particularly vulnerable…

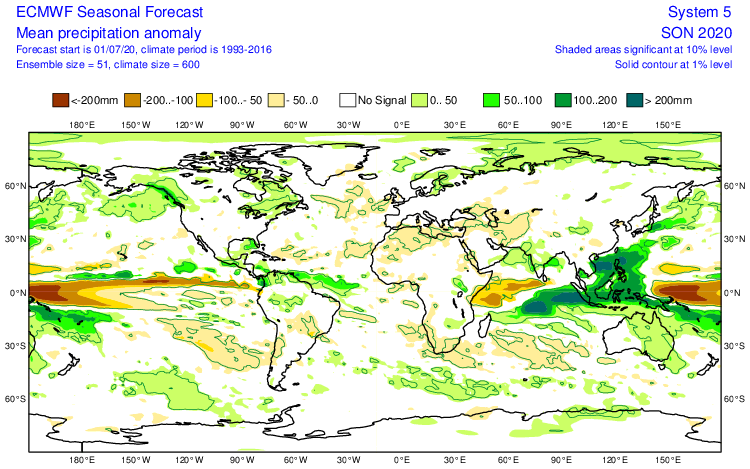
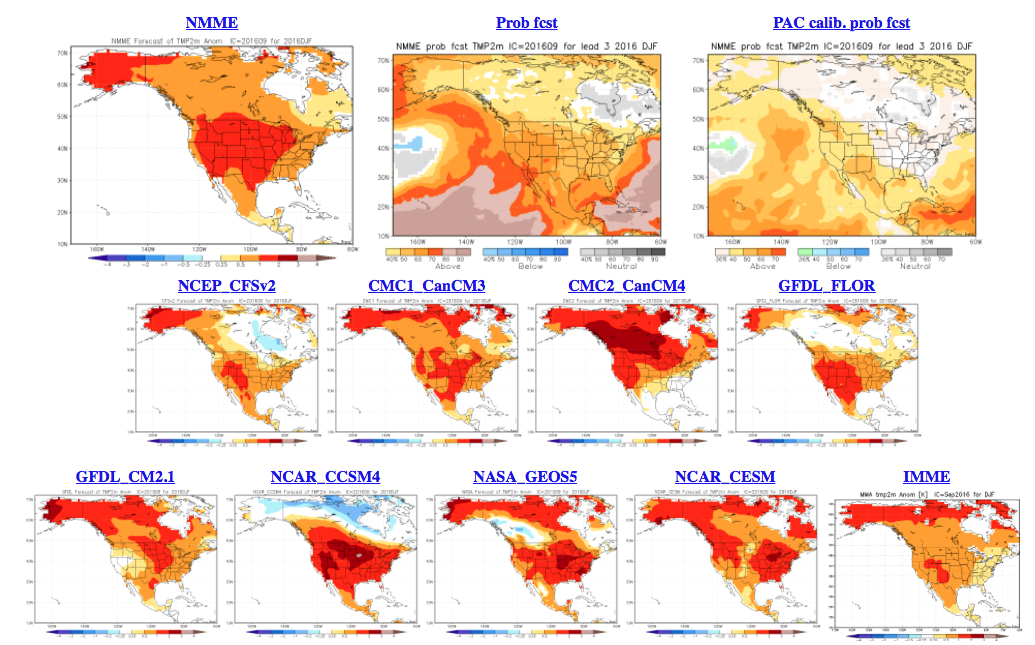
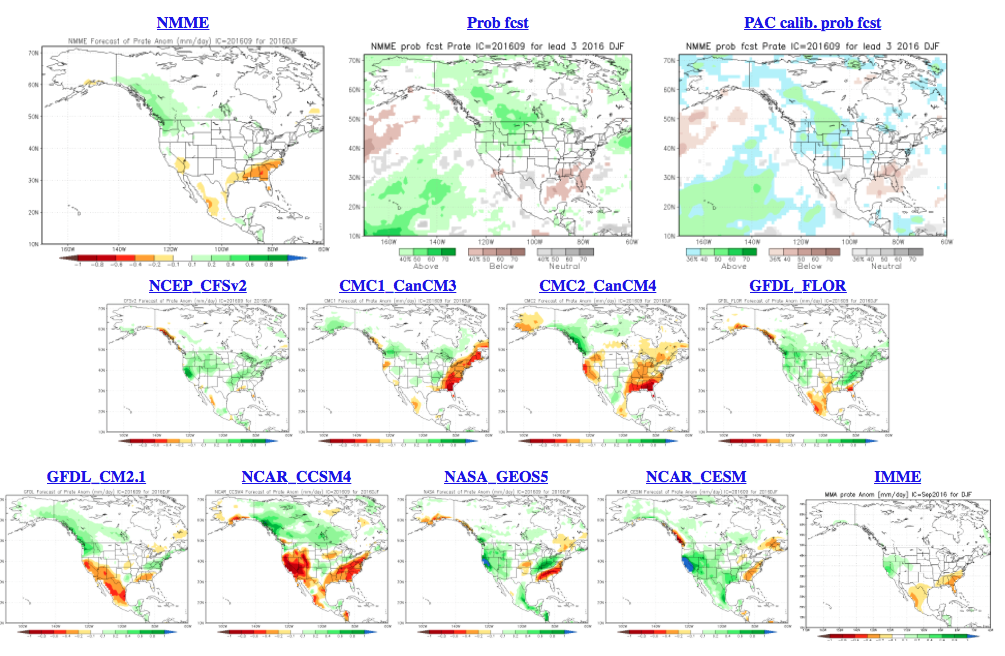
Most computer model data is leaning towards a warm autumn. We’d agree, overall, but leaning wetter than the majority of data right now, due in large part to tropical impacts.
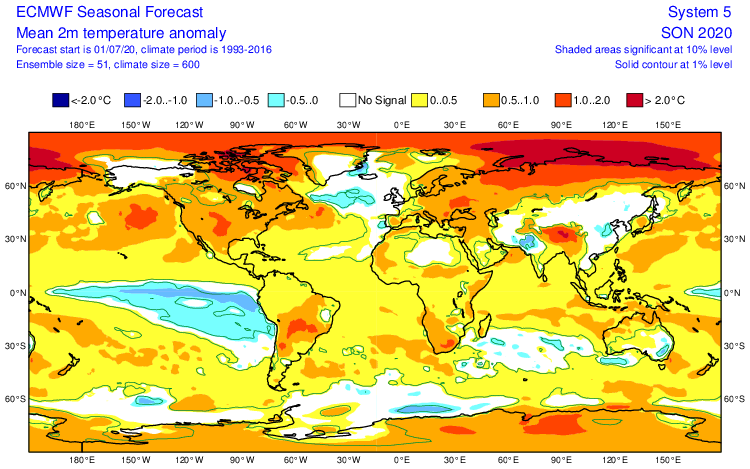

The coolest of the seasonal data is the CFSv2. It’s easy to interpret a cooler Central and East if the ridge and associated heat is so strong across the West. We will keep close tabs on trends over the next few weeks. Nina falls are notorious for at least a few weeks early on of unseasonably cool weather as well. Stay tuned.
As for winter, from this distance we’re bullish on a wetter, warmer than normal season, locally. Below normal snowfall is expected as of now. A dominant southeast ridge is expected to carry the day, at times flexing north into the TN and Ohio Valley.


Interesting, like fall, the CFSv2 is the “coolest” of the big 3 seasonal models. Again, we’ll continue to keep close eyes on trends. Given performance of recent winters past, you may say I’ll just go with the opposite of what these seasonal models say. You’d have good reason for doing so. Unfortunately, that southeast ridge almost seems like a lock though. It’s also becoming more difficult to ignore the trends over the past decade or two.
Much more later on both fall and winter! Enjoy your Sunday!


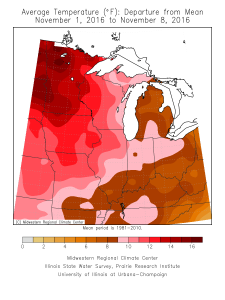 Speaking of warmth, 2016 has been a very warm year.
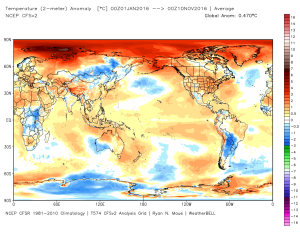 (The cold of 2014 seems so long ago…)
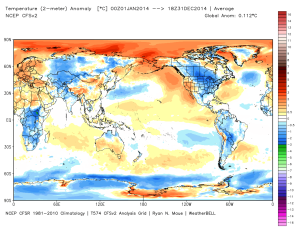 Back to present. We’ve targeted the middle part of November to finally beginning “bucking” the recent warm trend. This won’t happen overnight and will be a battle of back and forth, initially. Thus, the “step-down” label. To be clear, November, as a whole, will finish much warmer than average. It’s virtually impossible to counter the incredibly warm start. That said, we do anticipate “jabs” of colder air working in here over the next couple weeks. For instance, this weekend will feature lows in the 20s for most and highs not making it out of the 40s Saturday afternoon. (The average low and high at IND Saturday are 37 and 54).
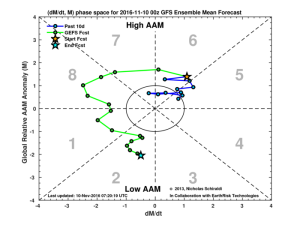
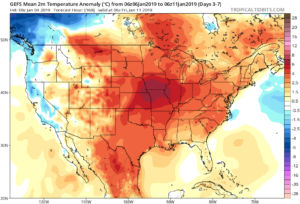
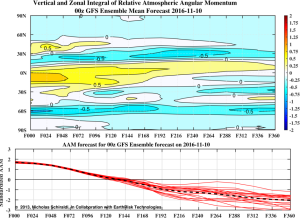 When we look at the AAM forecast (above), we note the westerlies may begin to slow (indicative of the negative values) in the 8-10 day period. This is crucial and, simply put, has to happen for the pattern to begin shifting into more of a position to allow sustained cold to enter the equation. We want to reiterate that this, in and of itself, doesn’t create the cold, but instead allows the pattern to begin shifting away from the Nino-like (warm) regime into more of a La Nina pattern, as a whole. – Hey, you have to start somewhere.
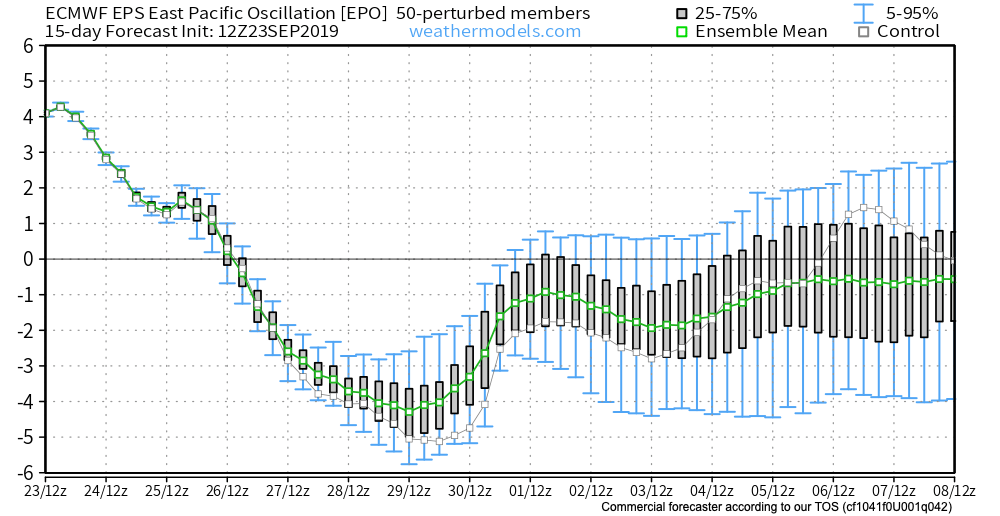
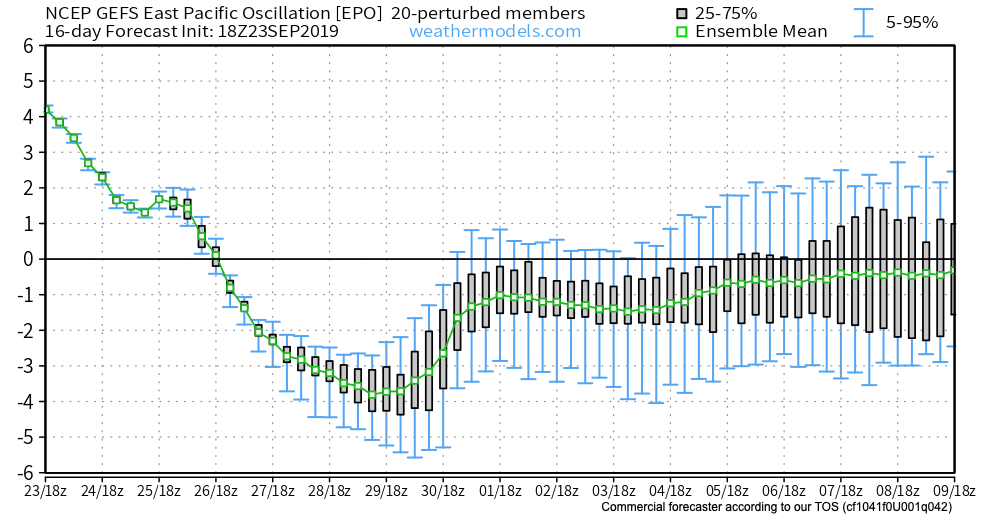
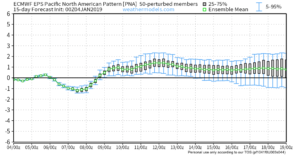
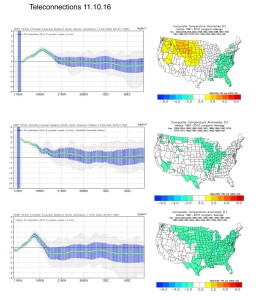 Additionally, the EPO is forecast negative off the GEFS and EPS. (Images courtesy of Weatherbell.com).
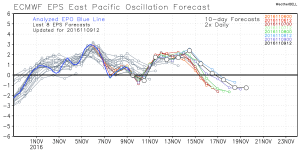
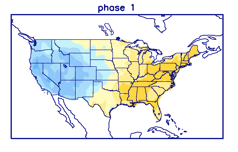
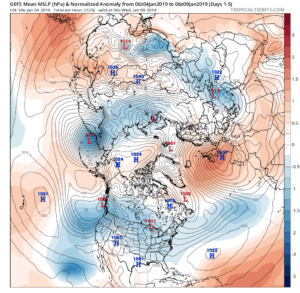
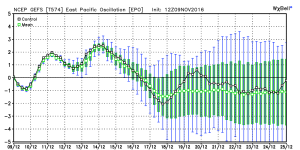 Again, this is a cold signal. (Image courtesy of Madusweather.com).
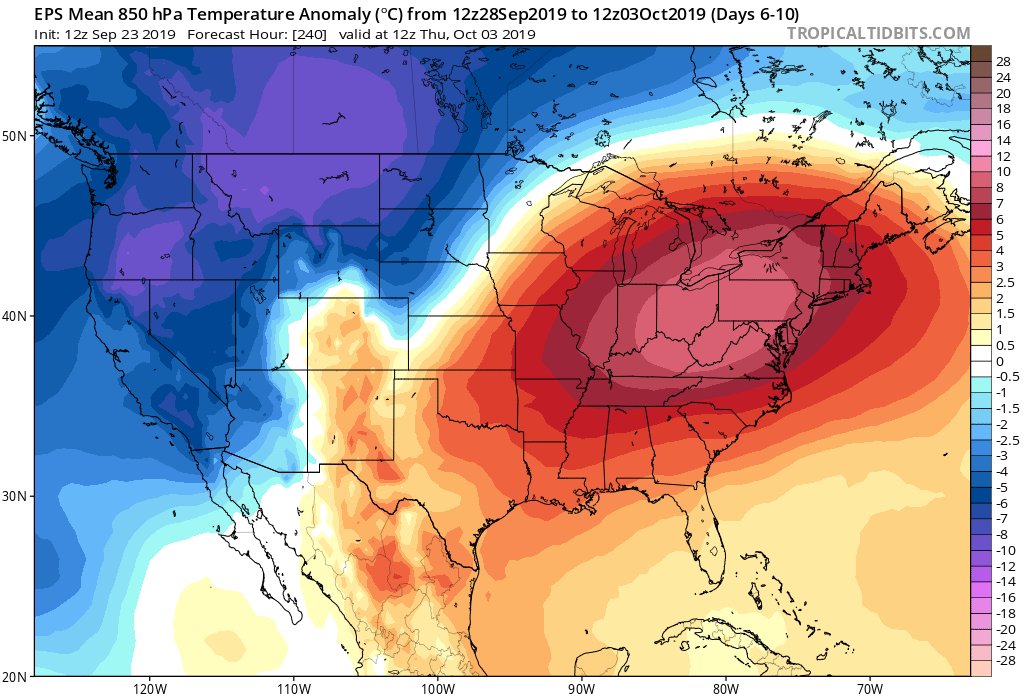
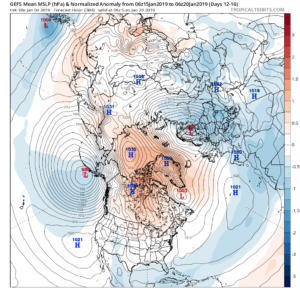
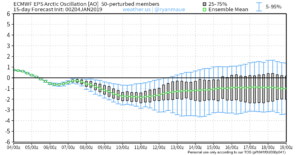
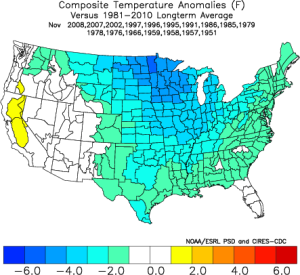 The ensemble data is also beginning to key-in on higher heights (blocking) developing over the top. Notice the significant changes in the overall look to the pattern between now and days 11-16. (Images courtesy of Weatherbell.com).
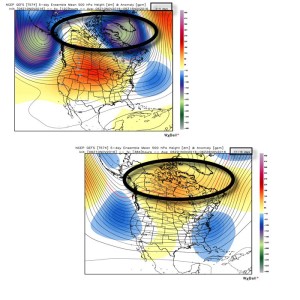 In summary, and in the face of *most* seasonal data that is screaming warm, warm, warm, we still don’t have any significant changes to our overall thinking of “step-down” mid-November giving way to more sustained wintry-like conditions in the overall sense from the Thanksgiving-Christmas period. Time will tell and only the Good Lord knows what the future holds, but we’ve done far too much work and research to throw the “game plan” in the trash before the game even begins…
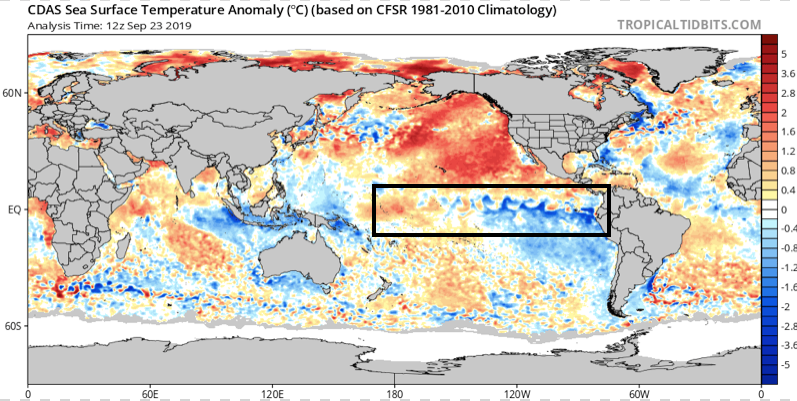
 In addition to the central PAC anomalies, we also are keying in on some other items of interest in the overall SST configuration:
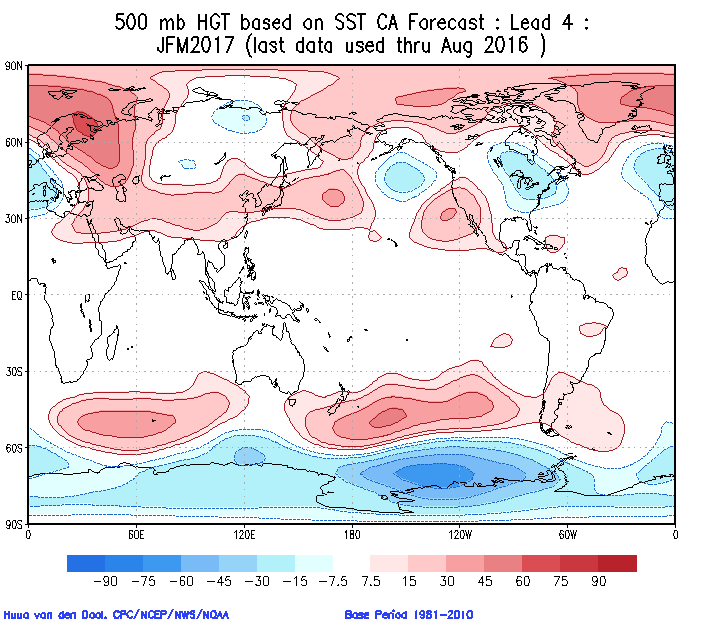
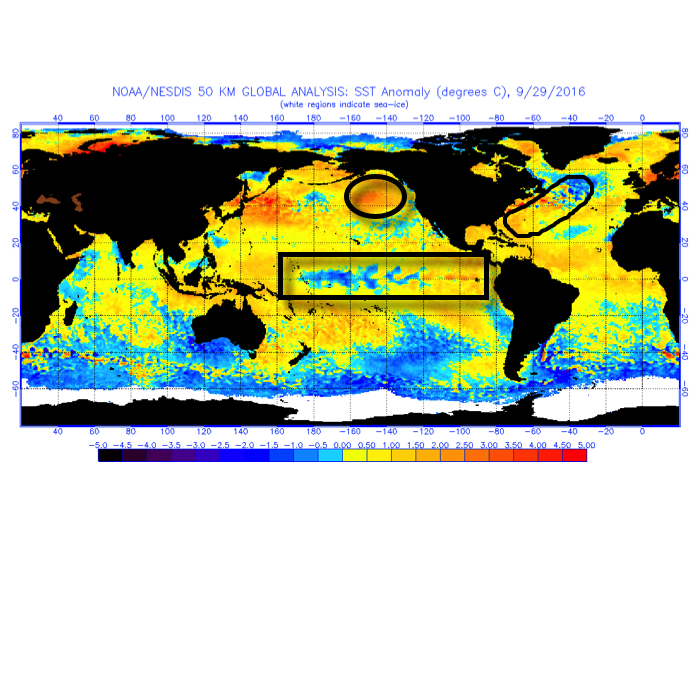 The SST CA model is quickly becoming one of our more trusted seasonal forecast models. We note how it becomes increasingly bullish on a central and eastern trough as winter wears on (by the way, this is likely to go deep into spring this year, too).
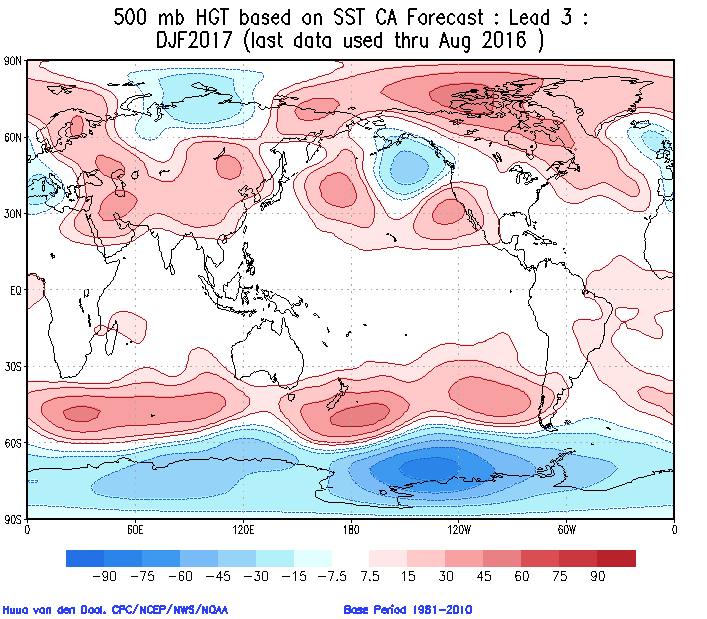
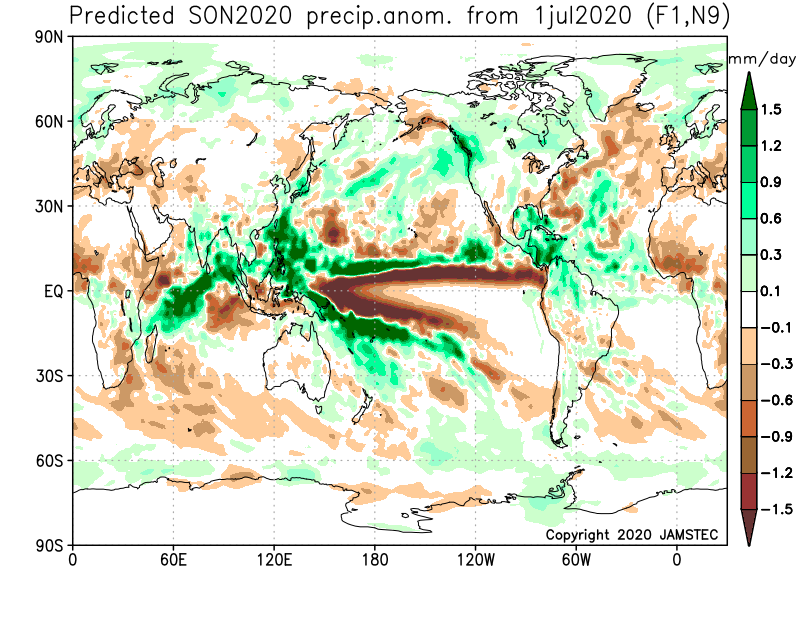
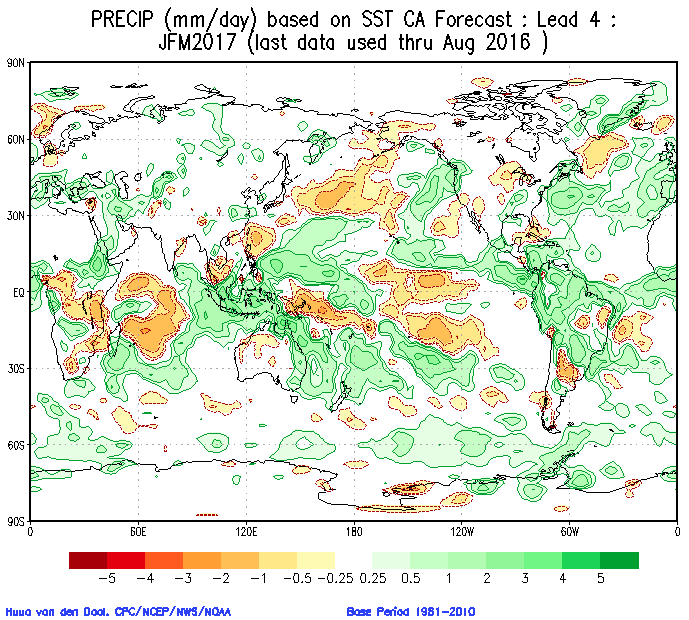
 Cold overwhelms the pattern and when you combine it with the active storm track (noted by the green hues, suggesting above normal precipitation through our neck of the woods), confidence is continuing to grow for an above normal snow season.
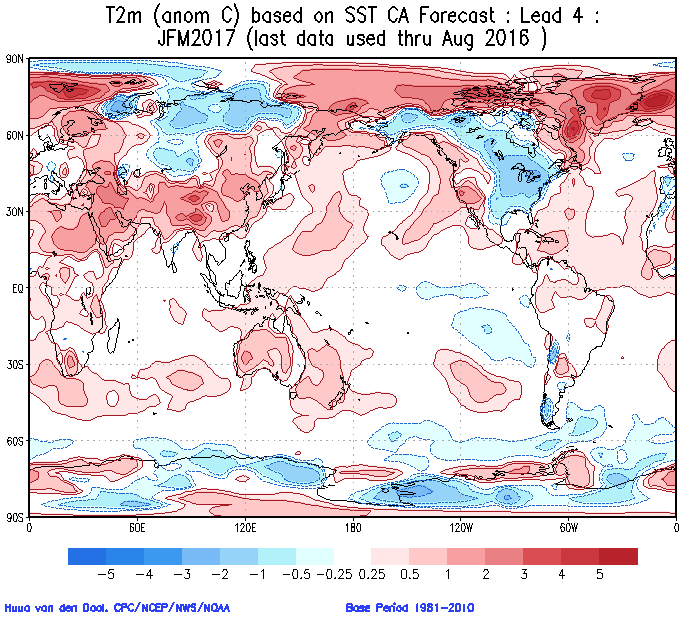
 The SST configuration on the JAMSTEC would suggest a cold, stormy set-up, locally. That said, while it sees the above average precipitation, it’s awfully warm at the surface.
 The NMME (to no surprise…) would suggest a very warm, wet winter.
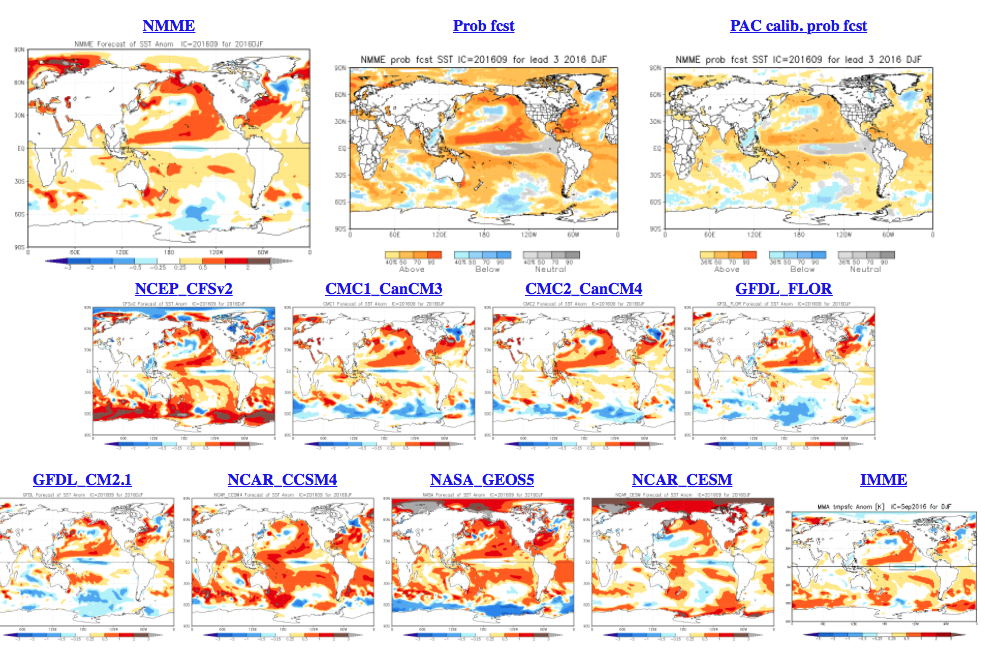
 As a reminder, our complete and final annual winter outlook will be posted here during the second half of October. That will include additional model data, along with several other points behind our reasoning for our winter forecast. As we always do, we’ll put “pen to paper” when it comes to our winter forecast, including our expected temperature and snowfall anomalies. Given the data above, including the warm JAMSTEC and NMME, it’s going to be very, very hard to see a warm winter here. In fact, our idea is for the exact opposite, given the SST configuration, and lines up more closely with the SST CA idea at this point. We’re also in the camp of a very, very active storm track through the Ohio Valley. “Big-hitter” potential is present from a winter storm perspective, especially given that we are likely to see resistance from the SE ridge.