Updated 08.08.21 @ 8:30a
Before we dive into the foundation of our fall outlook, let’s start off by taking a look at a few different computer models. What we show below includes what the European seasonal, CFSv2 seasonal, and JMA seasonal guidance believes will take place in the meteorological fall time frame, or September through November. (The exception to this is the JMA and it breaks down Aug through Oct).
European Seasonal (Sept-Nov)
“Horseshoe” blocky look from the Desert Southwest into the central and eastern Canadian provinces, extending into the north-central Atlantic. Taken verbatim, this kind of look is notorious for an overall cooler to colder than average period into the Plains and East. Perhaps the model is trying to sniff this out, but as you see with the temperature anomalies, it’s more of a seasonal look. The European is also painting a dry autumn for a sizable chunk of the Lower 48. The lone exception? The PAC Northwest.
JMA Seasonal (Aug-Oct)
The model, too, has a blocky look, centered over the eastern Canadian provinces. The warmer than average temperatures are found underneath this ‘mean’ ridge position from the Southwest states, into the Rockies, and into Canada. Meanwhile, it’s more of a seasonal look for the southern Plains into the Ohio Valley, and East. Above normal precipitation is noted along the eastern seaboard and PAC Northwest.
CFS Seasonal (Sept-Nov)
The blocky look continues to be the theme, but the CFS is more bullish in the placement of an eastern trough and subsequent cooler look (compared to normal) from the northern Plains into the Southeast, including right here in the Ohio Valley. Large-scale drier than normal conditions are painted along the Gulf Coast into the Southeast states with wet conditions shown for the upper Midwest and Great Lakes.
The models serve as guidance, but must be taken with a grain of salt. When talking about weather patterns months ahead of time (some cases even a couple of weeks out), the risk is very high and, in many instances, things must be adjusted as fresher data is digested into the computer models. With that said, we can take clues from the data and combine that with current sea-surface configurations (solar activity, as well) to try and add more value to seasonal ideas.
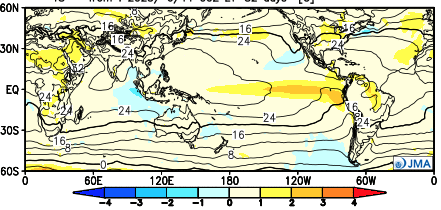
We expect a weak La Nina to hold through autumn, shown above.
The current sea-surface temperature anomalies illustrate this, as well (cooler equatorial Pacific waters). We also note a couple of additional interesting features that will require a keen eye as we move forward deeper into the fall and as winter approaches:
I. very warm waters in the MDR (main development region) of the tropical Atlantic
II. warmer than normal waters in the Gulf of Mexico
III. well above normal waters across the northern Pacific
We do believe the models are on to the blocky look and this kind of pattern should help produce a “normal” to slightly cooler than normal autumn here in central Indiana. Don’t be surprised by a potential earlier than normal frost (average first frost occurs Oct. 11th). We’re also expecting a robust heart of the hurricane season, and expect a busy time of things in the Gulf of Mexico and along the southeast Atlantic coastline. Given that, I’d lean more towards the precipitation configuration as painted by the JMA. Slightly wetter than normal is the call for central Indiana (0.5″ to 1.5″ above normal for the season, as a whole).
Looking back at last fall shows the coolest anomalies centered in the Plains with warmer than normal conditions across the West and East, including slightly warmer than normal readings here in central Indiana.
We have to go back to 2018 and then 2014 to find cool (or in the case of 2014, cold) autumns, locally.
Happy *Almost Fall, Y’all…