Author: Bill McMillan
Owner & Chief Forecaster- IndyWx.com
Date: 11.01.20
Indianapolis averages 25.5″ of snow per year. To the dismay of many snow lovers across central IN and all across the Ohio Valley, for that matter, we were well below average (9.3″ below normal at IND) last year. Not only have the bulk of the winters over the past decade featured below average snow (couple of outliers, most notably the infamous ’13-’14 winter), but they’ve featured a lack of cold, as well.

What’s even more impressive is that’s with a few extreme cold winters thrown in the mix. (Just goes to show when warm, we’re running really warm).


When building a seasonal outlook, it’s always important to begin with a look at the current ENSO (El Nino/ Southern Oscillation) state. Typically, things fluctuate between El Nino (warm waters in the equatorial Pacific) or La Nina (cool waters in the equatorial Pacific). This year, we’re looking at a weak-to-moderate La Nina.
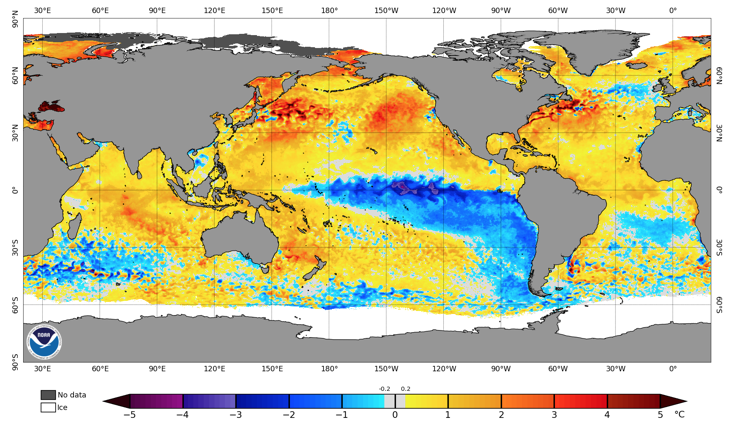
This is forecast to persist through the winter and upcoming spring:
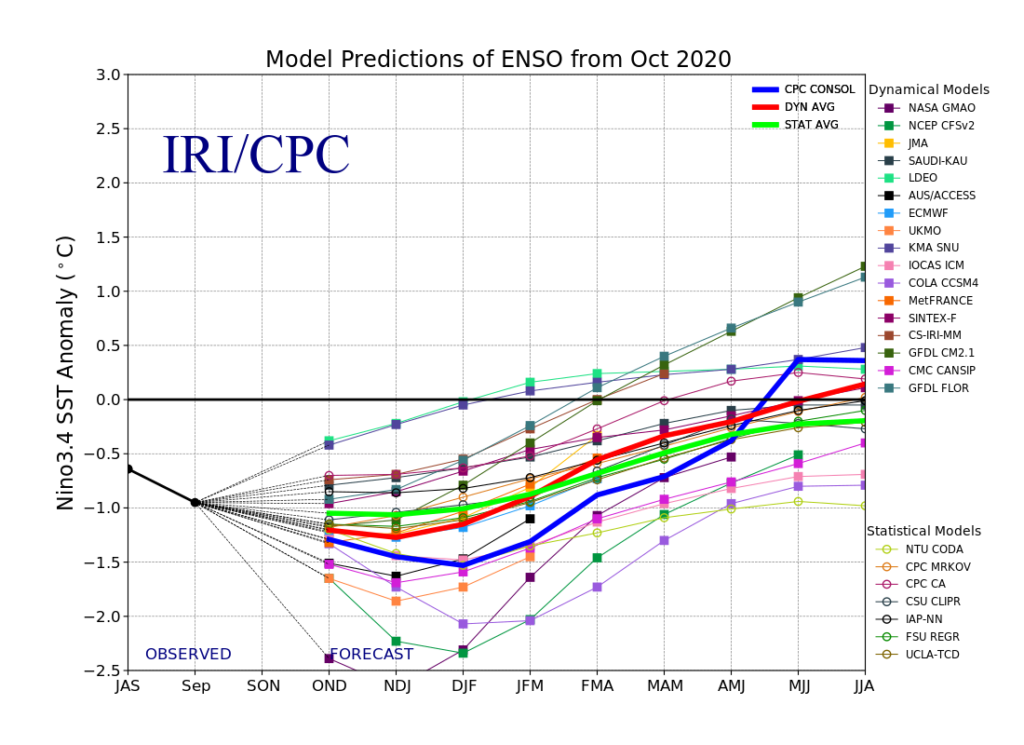
Weak-to-moderate La Nina winters typically produce slightly less than normal snowfall across our neck of the woods, but can also lead to a couple of “big hitters” if the moisture-laden storm systems notorious with Nina winters can combine with the marginally cold air. In most of our analog years, it’s tough to get the cold to “lock in.”
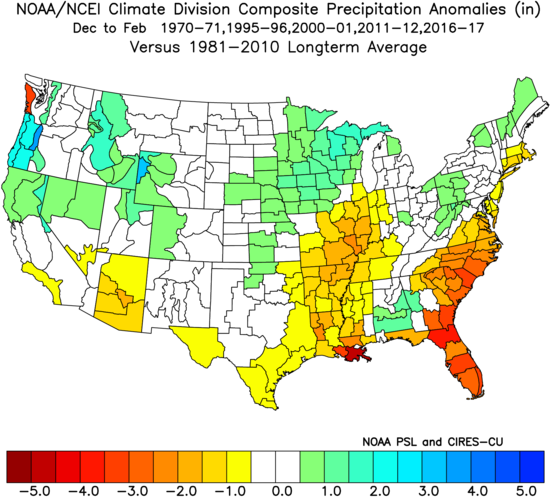
If we simply base our analog package on weak-to-moderate Nina winters, we’ll want to include the following years:
1970-1971
1995-1996
2000-2001
2011-2012
2016-2017
All of these are 1st year weak-to-moderate La Nina winters.
Precipitation Anomalies
Temperature Anomalies
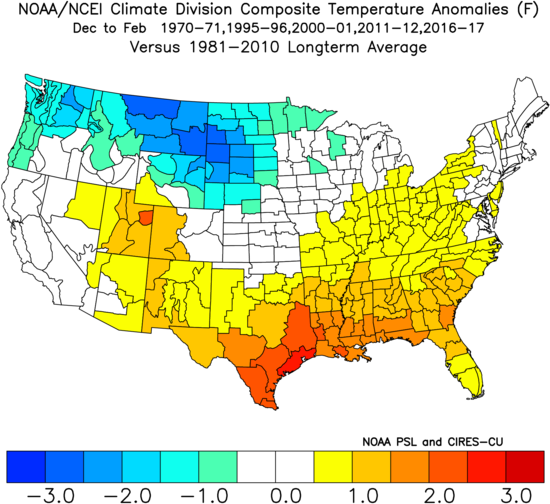
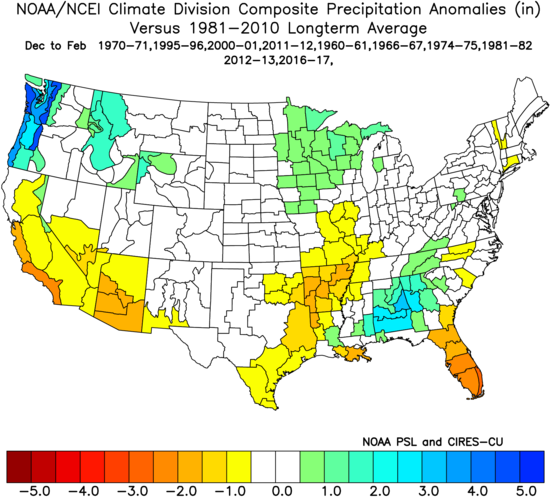
That can serve as a baseline to the general idea, but we want to dig deeper. Recall that we’ve been experimenting with persistent negative AO’s (Arctic Oscillation) in October to try and generate further clues for the upcoming winter. When we add those years into the mix (factoring out any Nino years) and combine the weak-to-moderate 1st year Ninas, this is what we come up with:
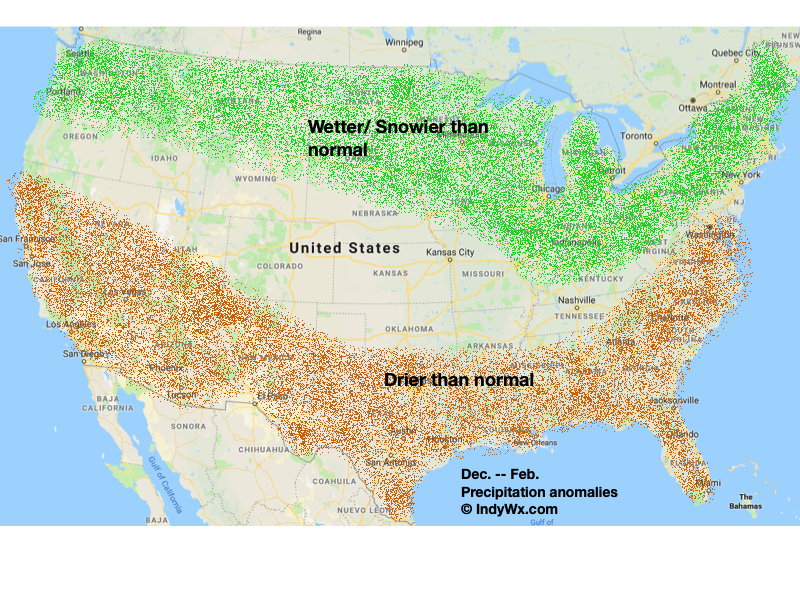
Precipitation Anomalies
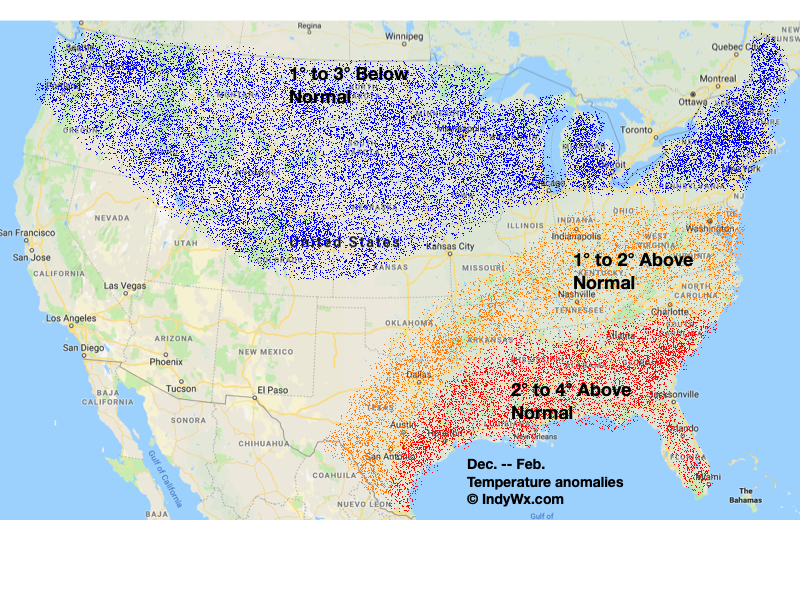
Temperature Anomalies
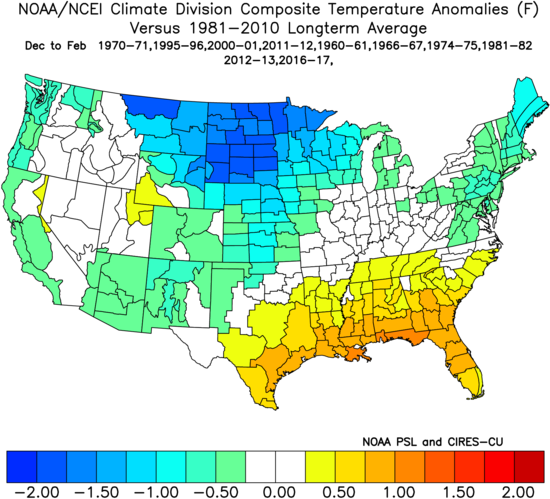
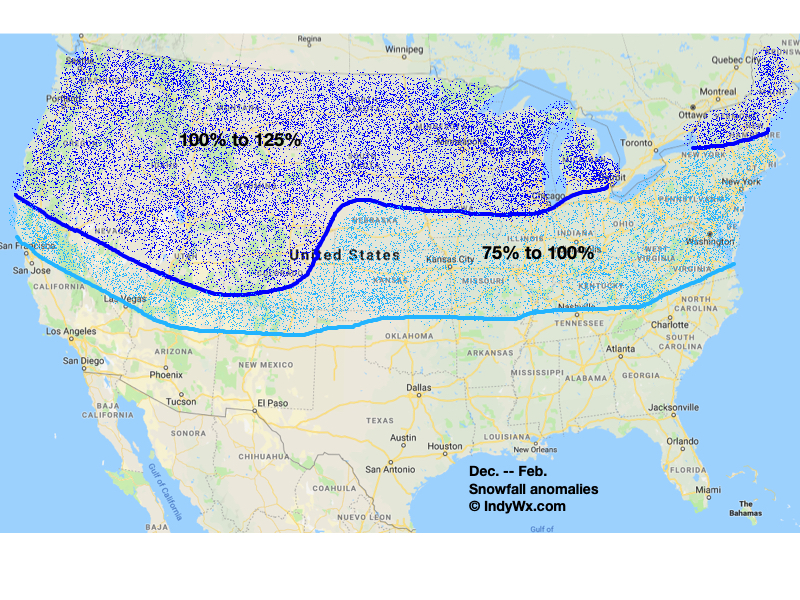
It’s this analog package that we’ll ride for the upcoming winter (adding ’60-’61, ’66-’67, ’74-’75, ’81-’82, and ’12-’13 into the mix). We, obviously, will factor in recent climate trends with any year pre-1970.
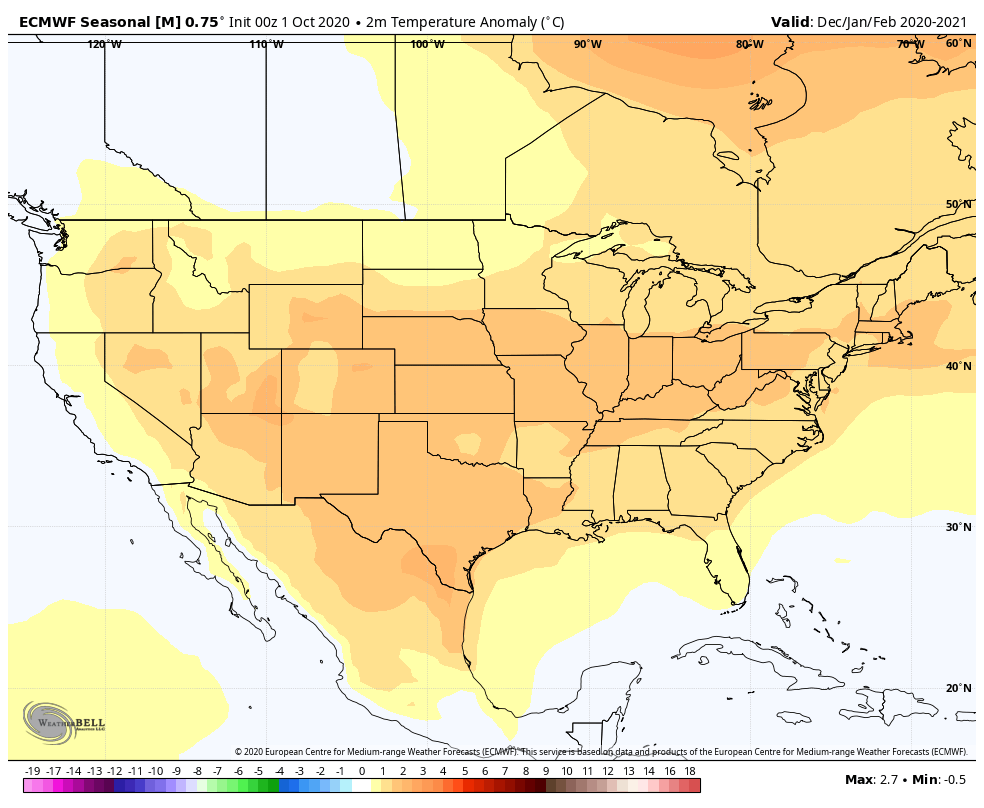
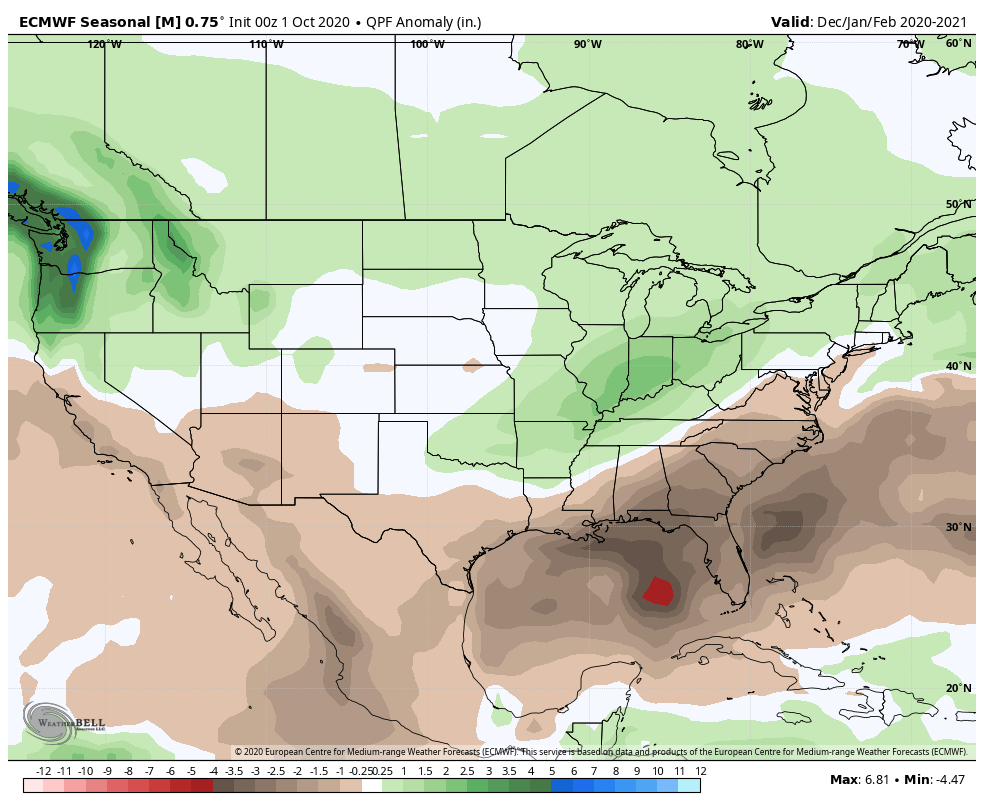
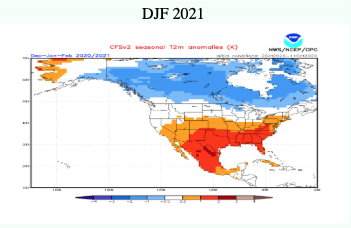
With all of that said, and before we unveil our official outlook, let’s take a look at what some of the seasonal model data suggests for the upcoming winter (December through February to be more precise).
European
CFSv2

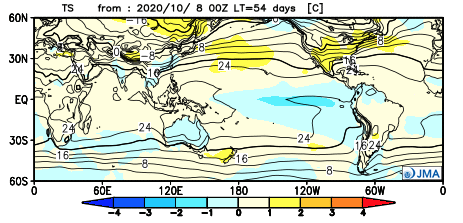
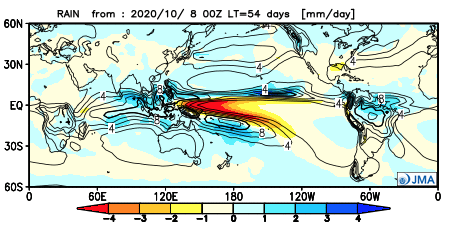
JMA
JAMSTEC
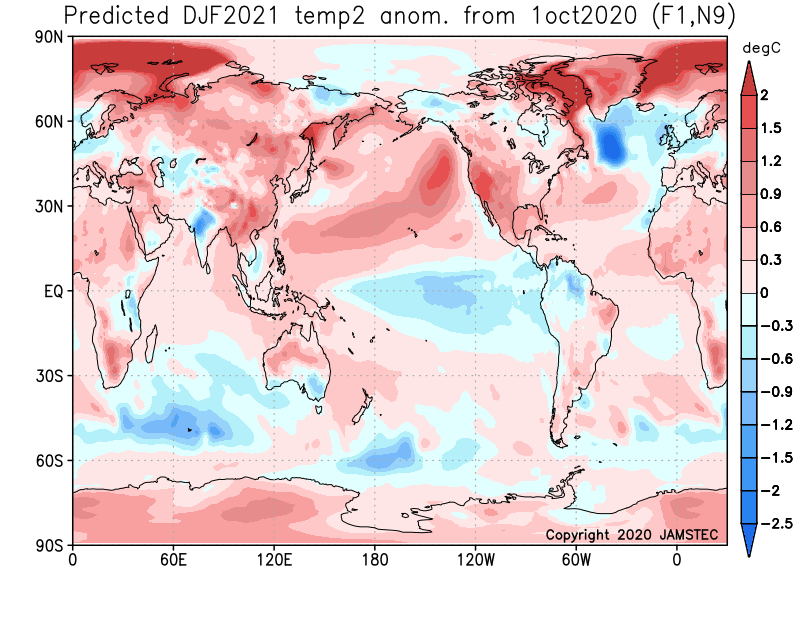
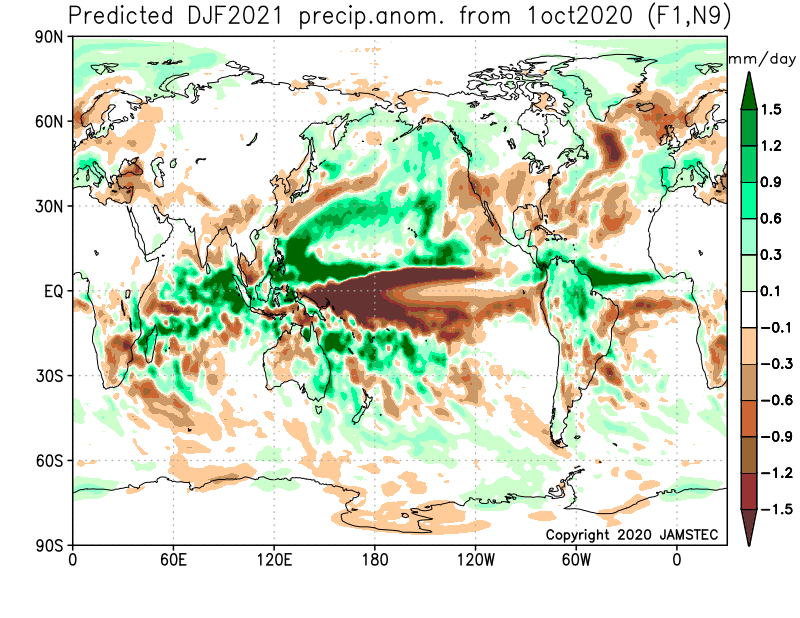
The bulk of the model data above shows a “typical” Nina pattern, but we know each and every winter has it’s own personality…
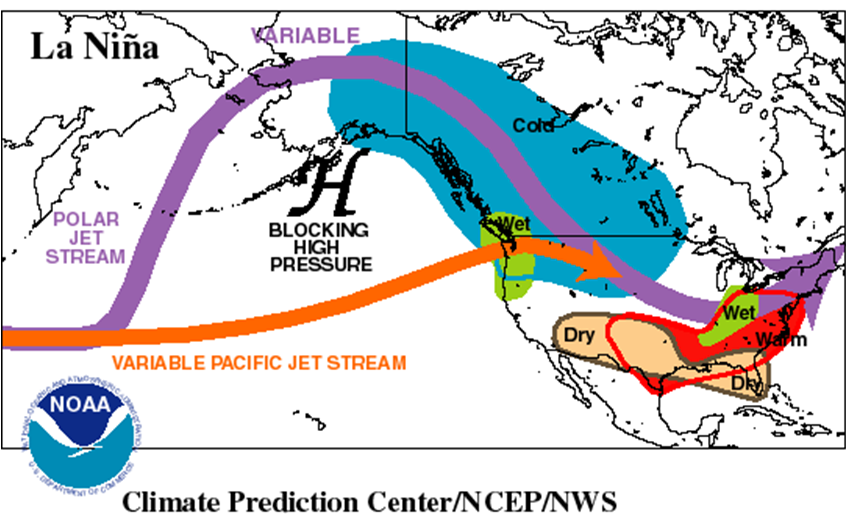
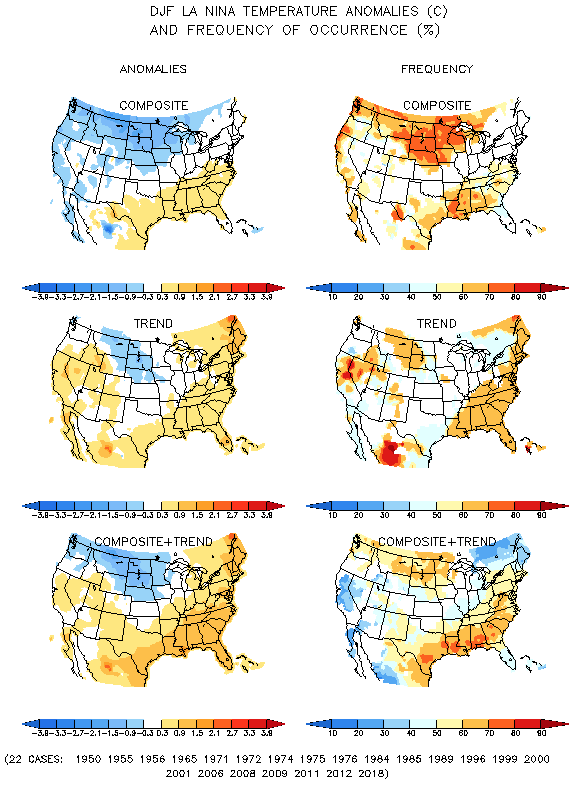
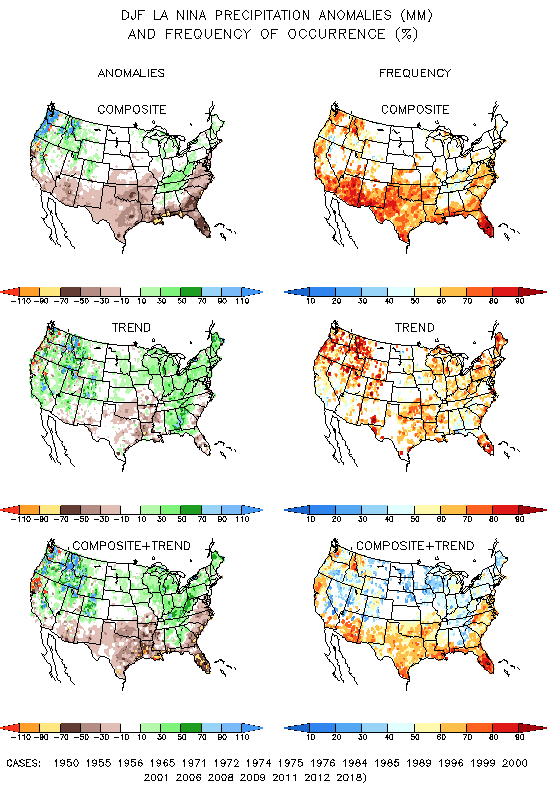
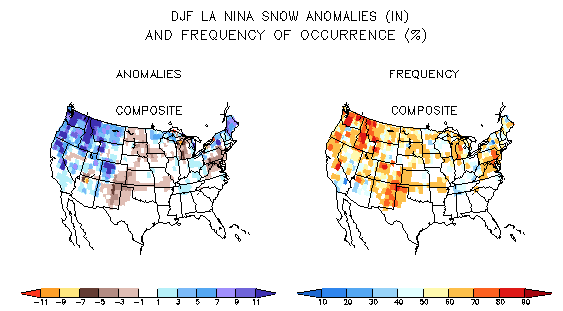
The wild card this year has to do with blocking, along with MJO amplitude. Both of these are tough to pin point from this distance for the upcoming winter season and will require our attention as we draw closer. That said, the more I research the persistent negative October AO, the more intriguing things become for winter lovers. This is the one item that’s keeping me from “torching” our winter outlook, locally.
Drum roll please: With everything laid out above, our official forecast will call for temperatures to run 1.5° above average at IND in the December through February timeframe with slightly below normal snowfall. Officially, we’ll forecast 20″ of snow at IND (first flake to last flake), but caution that we could have a couple wet, heavy events that make up the majority of that.
Wishing you and yours a blessed holiday season and safe, happy winter!
